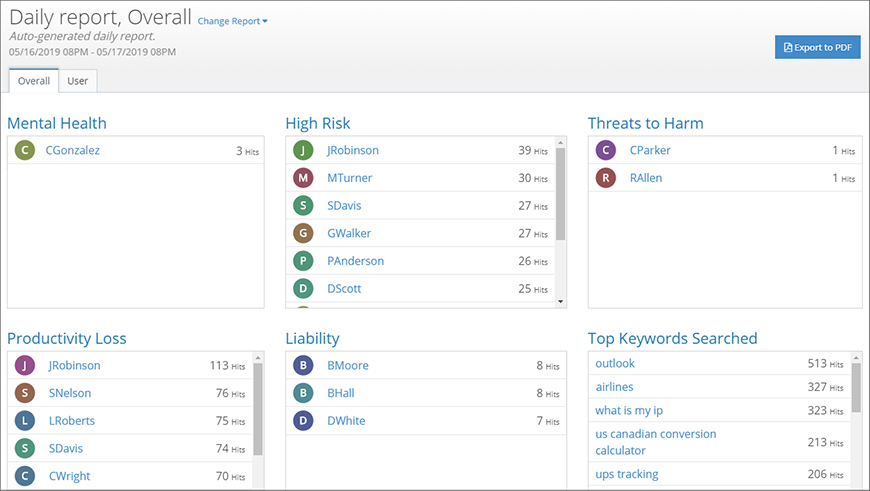
Do these stories look familiar?
- You receive an urgent request for a report that details the recent network activity of a user. Additionally, this report must clearly highlight any behavior that suggests a threat of violence.
- You’ve been tasked with identifying users who are attempting to access high-risk content that could pose a liability.
- As a part of a new initiative to improve productivity, you’ve been asked to build a report that reveals which users are indulging in excessive amounts of non-work-related Internet browsing.
The User Risk Dashboard makes it easy to fulfill these requests.
Quickly identify high-risk network activity.
When you are tasked with reviewing the network activity of a user, the request is usually time-sensitive. There may be a possible threat, a concern about the well-being of a colleague, or even pending litigation. While existing reporting tools give you details about the activity within your network, the User Risk Dashboard saves time by giving you a focused selection of your data. This makes it easier for you to quickly identify high-risk user activity and productivity loss.
Reveal hidden productivity loss.
While many organizations permit a small amount of personal use of network resources, the amount of non-work-related activity may be excessive for some users. Common distractions include watching streaming videos, playing online video games, or visiting social media sites.
The User Risk Dashboard exposes user network habits that waste time and consume bandwidth.
Instantly generate user risk reports.
The User Risk Dashboard makes it easy to generate timely and credible reports that can be exported as PDF files. And this can be done without rummaging through logs and piecing information together.
With the push of a button, create a report that is both human-readable and polished.
Step-by-Step Introduction
Here’s a quick overview of how the User Risk Dashboard works.
Step 1: Locate the User Risk Dashboard
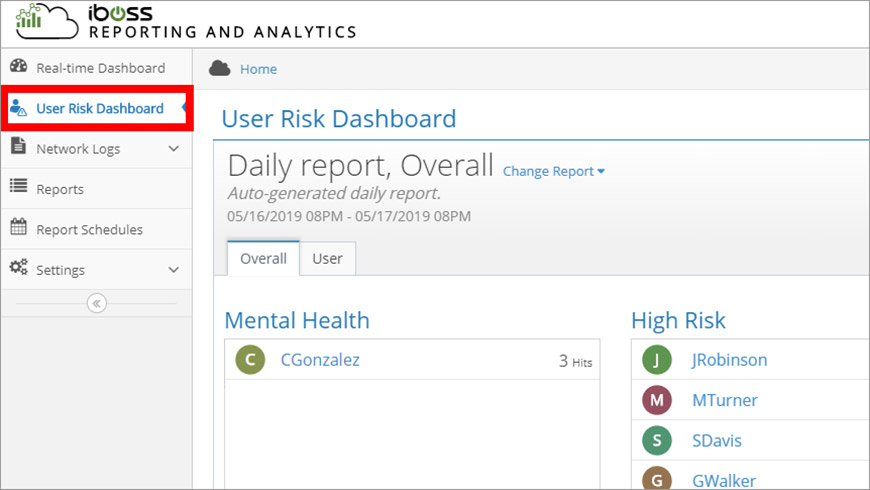
From the iboss Home page, click the Reporting & Analytics tile. Notice that the sidebar contains a User Risk Dashboard button (Figure 1).
Step 2: Use the Overall view to identify high-risk users
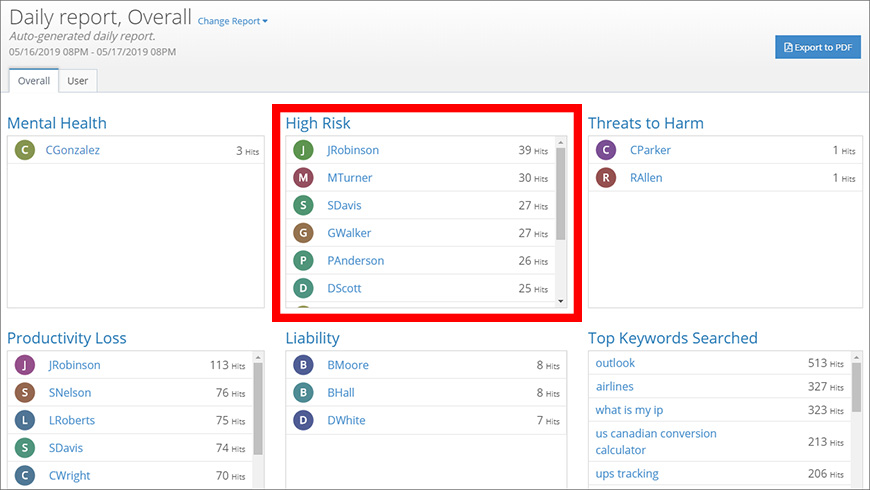
The Overall view includes a set of panels, each displaying the activity for a specific type of activity that is considered to be either “risky” or is associated with productivity loss (Figure 2). The Top Keywords Searched panel ranks the top queries that users are submitting to search engines.
Notice how each panel sorts the users according to their activity. This allows you to identify the top users for each type of activity.
Step 3: Review the network activity of a user
The User Risk Dashboard allows you to toggle between the Overall view and the User view. From the Overall view, you can discover high-risk activity and productivity loss without having to sift and sort through user events. When you need to review the activity of a specific user, the User view provides a more granular level of detail.
There are a couple of ways to view the network activity details for a specific user:
- From the Overall view, click one of the users that are already listed in the panels.
- From the User view, you can manually search for any user.
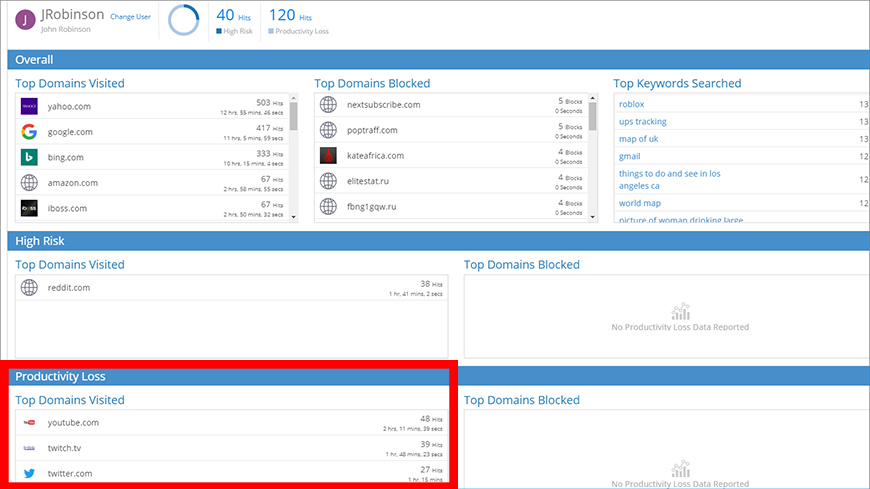
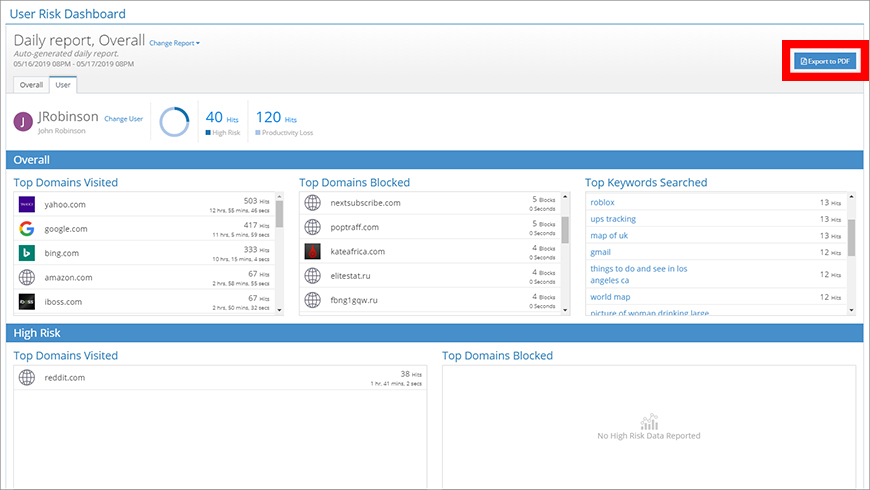
The User view displays the domains that the user visits the most in the Top Domains Visited panel. The domains are sorted by the number of hits. Notice that each domain entry includes both the number of hits and the estimated amount of time that is spent on the site. As with the Overall view, you can review the top keyword searches for this user.
Key features of the User view are the High Risk and Productivity Loss sections (Figure 3). They display visits to domains that are often associated with content that may be inappropriate, unsafe, or pose a liability.
Step 4: Instantly generate a report as a PDF file
To generate and download a report, click the Export to PDF button (Figure 4). This is found at the top-right corner of the User Risk Dashboard.
The details that are added to the new report are based on the current view. This allows you to intuitively create multiple reports from different contexts.
Step 5: Click a domain to review more details in the Event Log
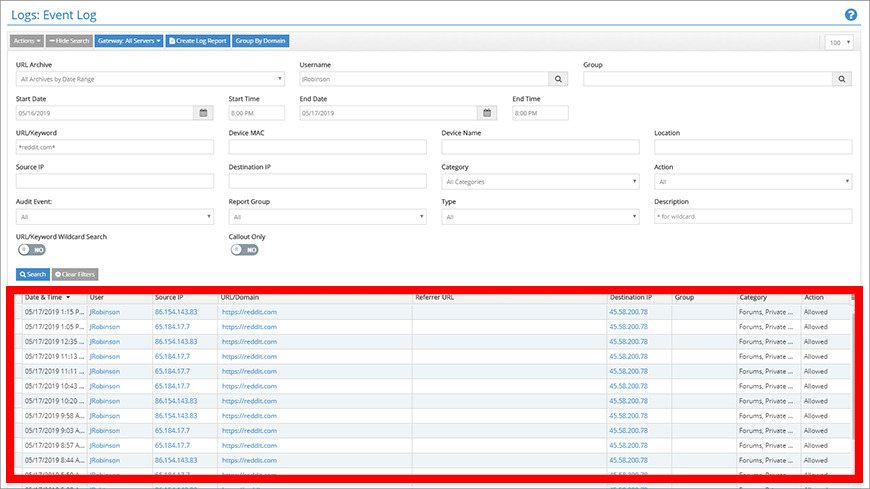
Clicking a domain entry from the User Risk Dashboard takes you to the Event Log. The filter controls are set to only display events for this domain.
From the Event Log, you have access to the finest level of detail for each access attempt. You can use the filter controls to adjust the types of events that are displayed.
Summary of Key Features
Let’s review the key features of the User Risk Dashboard:
- Get a convenient overview of your user network activity in a layout that highlights the most commonly-requested data.
- Quickly identify high-risk network activity that could pose a liability or indicate a potential safety threat.
- Reveal hidden productivity loss caused by excessive, non-work-related, personal browsing that wastes time and consumes bandwidth.
- Easily toggle between a summarized “Overall” perspective and a detailed “User” view.
- Instantly generate reports that can be used to fulfill requests for audits of recent user network activity.
